Debug Tests in Chrome Developer Tools
Starting with version 6.3.0, Node.js allows you to debug applications in Chrome Developer Tools. If you have Chrome and an appropriate version of Node.js installed on your machine, you can debug TestCafe test code.
This topic describes steps that apply to Node.js v8 and newer.
First, run TestCafe in the Node.js debugging mode. To do this, add the --inspect-brk flag to the test run command.
testcafe --inspect-brk chrome ./tests
Put the debugger keyword in test code where you want to stop.
fixture `My fixture`
    .page `https://devexpress.github.io/testcafe/example`;

test('My test', async t => {
    debugger;
    await t
        .setNativeDialogHandler(() => true);
        .click('#populate')
        .click('#submit-button');
});
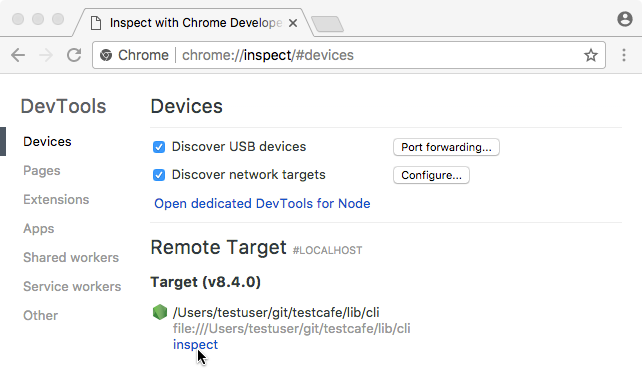
Navigate to chrome://inspect in Google Chrome. In the Remote Target section, find the Node.js debugger and click Inspect.

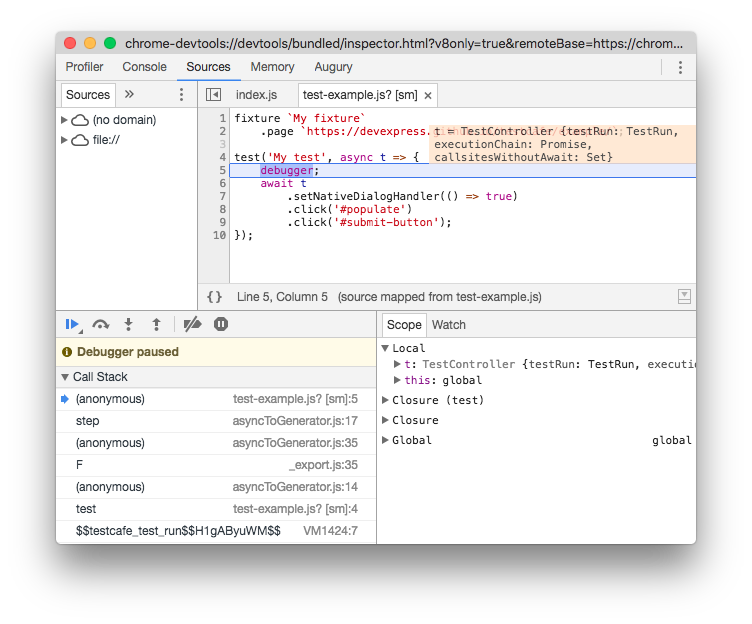
Chrome will invoke its Developer Tools and the debugger will stop test execution at the first line.
Click the Resume script execution button or press F5 to continue. After that, text execution will pause at the debugger keyword allowing you to debug test code.
